You’ve flashed your old WRT54G or other vanilla router with the Tomato firmware. This itself turns your router into a lean, mean routing machine with QOS, SSH and more, but let’s say we want to take it a bit further. What it we want to get some more stats out of it?
In order to do this, we first need to set up a way to pull this information from the router. The best way to do this is to install an SNMP (Simple Network Management Protocol) daemon on the system.
The main roadblock we face here is that the system mainly runs in volatile system memory, meaning that every time the system is rebooted the filesystem is reset. Fortunately Tomato provides a way to get around this using CIFS shares. Follow the steps below (as modified from here) to install an SNMP server on a Tomato router.
- Create a network (samba, CIFS) share somewhere on the network. This computer must be on all of the time in order for Tomato to run the SNMP server.
- Download the snmpd.zip file from one of these locations:
[xs4all.nl] [systembash]expand the binary and .conf file into the share or a subdirectory (for example, <share name>/snmp)
MD5 for snmpd binary is ae0d622648efdb8dceb7b3b5a63e23ac
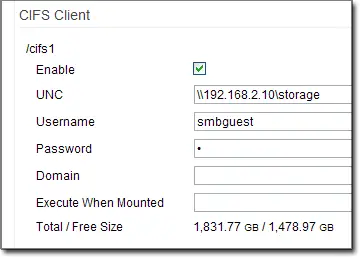
- Set up the shared directory on the router. Visit Administration->CIFS Client. Add the share as follows, with your correct share information:
- Log into the Tomato router via ssh, and start SNMPd on the router by issuing the command:
/cifs1/snmp/snmpd -c /cifs1/snmp/snmpd.conf &
- Test that SNMP is running and can be accessed on another computer on the network. To test it, you can use snmpwalk like so:
snmpwalk -c public -v 2c <IP Address of Router>
If it works properly, it will list the available OIDs from the router. You do not need to take note of these, but they will be used in the graphing software later.
- Finally, we need to launch the SNMP server when the router is restarted. You do this by adding the command to start it in the area Administration -> Scripts -> Firewall:
sleep 30
/cifs1/snmp/snmpd -c /cifs1/snmp/snmpd.conf -s &
This launches the snmp server 30 seconds after the router is started or rebooted.
Thats it! SNMP is now running on the router.
Now to add this SNMP host to your graphing software. For this example, I will use Cacti, which I will assume you have already set up. If you need to set it up, please follow the directions on the Cacti site for installation.
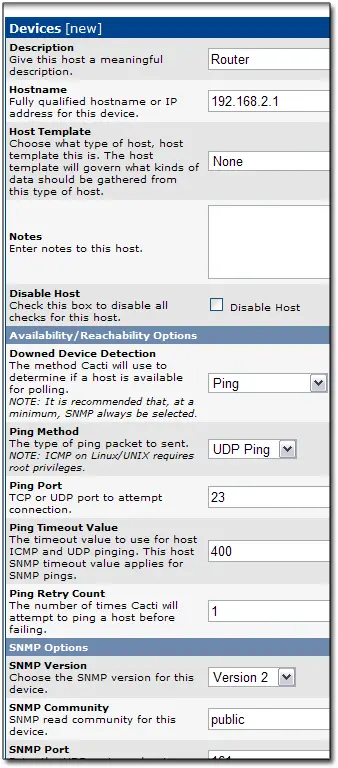
First, add the router as a new device, using the information below (change IP to suite your needs):
After adding the device, you have several options depending on what sort of data you are looking for. For system information on the router – for example CPU usage, memory usage, etc; you can go directly to Create -> New Graphs. Select your device and then add the graph you are looking for.
The graph will show as a broken image at first, or a blank graph with “NaN” as the data source. Give it a few minutes to update, and the information should start to flow through. The ucd/net options work best, but feel free to experiment.
To get traffic stats on the interface, you first need to “Walk” the device. Go back to your device list, and edit the device you added. Under “Associated Data Queries”, Add Data Query, add “SNMP – Interface Statistics” with Re-Index period as “Uptime goes backwards”. After adding it you should see under status something like: Success [39 Items, 6 Rows].
Since these data sources are now added, you can go back to Add a new Graph. After selecting the device, you should see a list of these new interfaces. Select the interfaces you wish to graph, and select the graph type (I suggest In/Out bits with Total).
After a few minutes, the data should start filling in. After a while, you will get a graph like this:
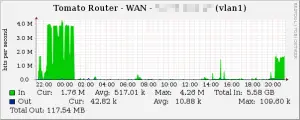
In conclusion, with a little work, you can get enterprise class graphing from your consumer router. The total project took me about 45 minutes, and I was trying to figure out all of the data sources and the correct way to enter everything.
Let me know your experiences, suggestions and corrections!


14 comments
Excellent guide! I got SNMP up and running on my Tomato-firmware’d WRT in no time based on your instructions.
Thank you! :)
Excellent guide! I got SNMP up and running on my Tomato-firmware’d WRT in no time based on your instructions.
Thank you! :)
@Michael Colbert: That is great! Thanks for letting us know.
@Michael Colbert: That is great! Thanks for letting us know.
man, this rocks! thanks a million.
man, this rocks! thanks a million.
Another version here
http://gitorious.org/tomato-vpn-snmp
Another version here
http://gitorious.org/tomato-vpn-snmp
Nice walk-through. I’ll give this a shot on my work router a bit (wrt54g runnign Tomato). :)
Question: Do you think it is possible to monitor the bandwidth of individual IPs behind the firewall from the router? For example, who is using all of the bandwidth?
Nice walk-through. I’ll give this a shot on my work router a bit (wrt54g runnign Tomato). :)
Question: Do you think it is possible to monitor the bandwidth of individual IPs behind the firewall from the router? For example, who is using all of the bandwidth?
Question: can it be that this only works on the LAN interfaces and not on the WAN interface? Because I don’t get any response from my WRT54GL, executing this:
jan@box:~$ sudo snmpwalk -c public -v 2c WRT54GL.lan
results in this traffic only:
17:27:59.199574 IP 192.168.12.1.50169 > 192.168.12.3.161: GetNextRequest(25) .1.3.6.1.2.1
17:28:00.200626 IP 192.168.12.1.50169 > 192.168.12.3.161: GetNextRequest(25) .1.3.6.1.2.1
17:28:01.201733 IP 192.168.12.1.50169 > 192.168.12.3.161: GetNextRequest(25) .1.3.6.1.2.1
17:28:02.202780 IP 192.168.12.1.50169 > 192.168.12.3.161: GetNextRequest(25) .1.3.6.1.2.1
17:28:03.203828 IP 192.168.12.1.50169 > 192.168.12.3.161: GetNextRequest(25) .1.3.6.1.2.1
17:28:04.204876 IP 192.168.12.1.50169 > 192.168.12.3.161: GetNextRequest(25) .1.3.6.1.2.1
and I’m sure there is a snmpd running:
# ps |grep snmpd
329 root 2764 S /cifs1/WiFi/snmpd -s -c /cifs1/WiFi/snmpd.conf
Any hints?
Neat thing to do with your router. SNMP traffic and cpu graphs on Cacti.
Comments are closed.