There is a very easy way to track opened TCP connections in Zabbix. Although it does not come built in to the Zabbix agent, it is simple enough to get. This method will allow you track the open number of TCP and UDP connections, as well as track TCP connections in TIME_WAIT.

Rather than using grep to count numbers in netstat, which can take an extraordinary amount of time on busy servers, I’ve used /proc/net/sockstat to get this data.
Add the following parameters to zabbix_agentd.conf:
UserParameter=sockstat.sockets,cat /proc/net/sockstat|grep sockets|cut -d' ' -f 3
UserParameter=sockstat.tcp.inuse,cat /proc/net/sockstat|grep TCP|cut -d' ' -f 3
UserParameter=sockstat.tcp.orphan,cat /proc/net/sockstat|grep TCP|cut -d' ' -f 5
UserParameter=sockstat.tcp.timewait,cat /proc/net/sockstat|grep TCP|cut -d' ' -f 7
UserParameter=sockstat.tcp.allocated,cat /proc/net/sockstat|grep TCP|cut -d' ' -f 9
UserParameter=sockstat.tcp.mem,cat /proc/net/sockstat|grep TCP|cut -d' ' -f 11
UserParameter=sockstat.udp.inuse,cat /proc/net/sockstat|grep UDP:|cut -d' ' -f 3
UserParameter=sockstat.udp.mem,cat /proc/net/sockstat|grep UDP:|cut -d' ' -f 5
Then you can either manually import these UserParameters into Zabbix, or use this template (if you’re using Zabbix 2.x).
Download the sockstat Zabbix template
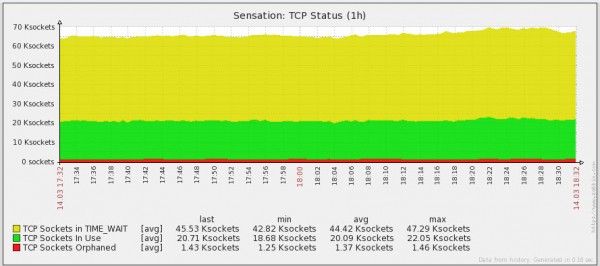
It includes the items and a graph for the socket stats. Enjoy!

2 comments
Thanx. Useful :)
Comments are closed.